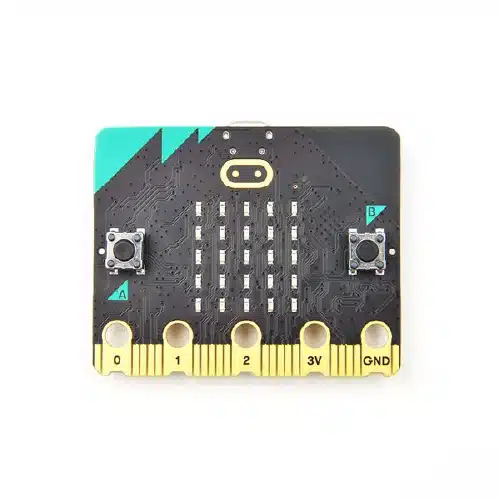
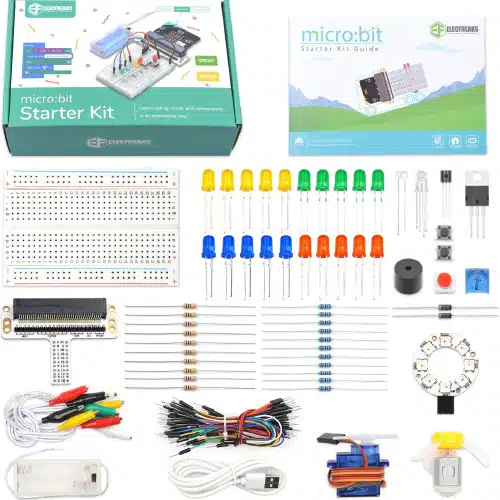
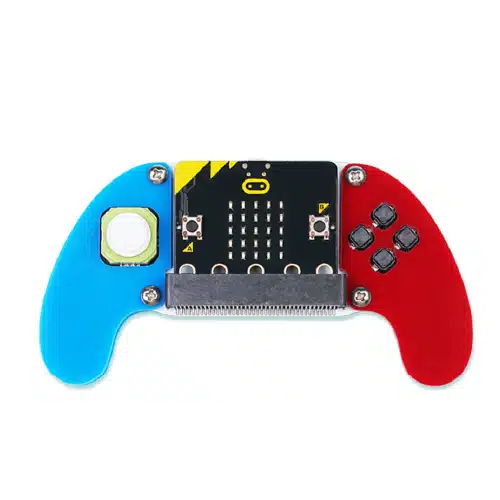
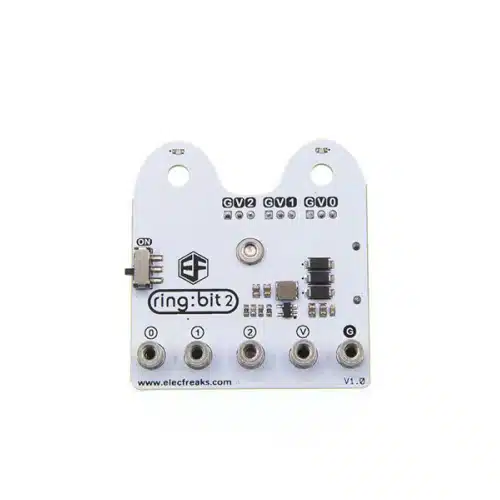
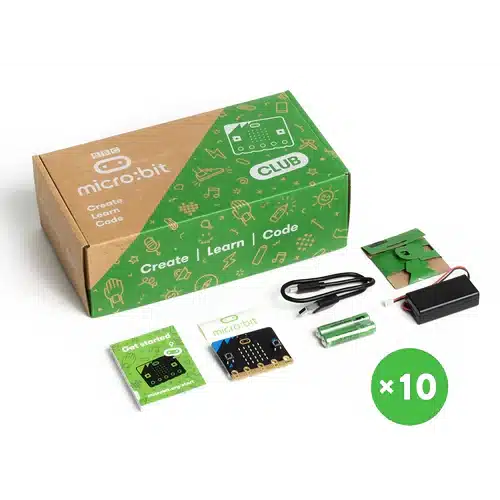
The ELECFREAKS BBC micro:bit Starter Kit is a comprehensive educational toolkit that provides all the essential components to sbuild interactive electronic systems using the micro:bit.
Contains:
- Breadboard and jumper wires
- LEDs and resistors
- Sensors: Includes a light sensor and a temperature sensor
- Button module
- Micro servo
- Battery holder
- Connection cables
STEAM Themes Developed Through This Kit:
- Coding and algorithms
- Data collection and analysis
- Mechanical movement
- Innovation and creativity
Benefits:
- Everything you need is included, ensuring a smooth setup and immediate start to learning
- Provides a solid foundation in coding and electronics, preparing learners for more complex projects