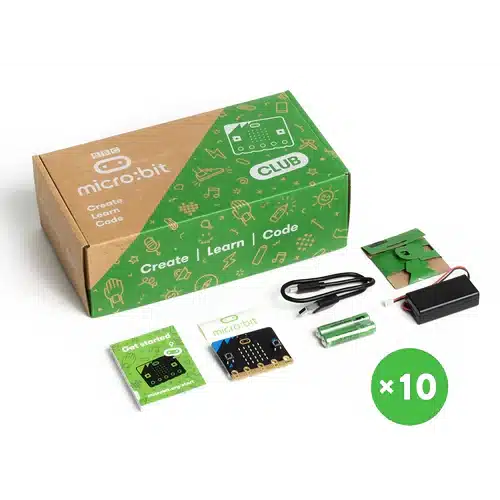
The ELECFREAKS BBC micro:bit V2.2 is the latest version of the micro:bit microcontroller. It is designed to help users of all ages learn the basics of coding, electronics and robotics through hands-on projects. With built-in sensors, LEDs and wireless communication capabilities, this microcontroller is a versatile tool for creating interactive and programmable devices.
Contains:
- BBC micro:bit V2.2 Board: A small, powerful microcontroller that includes a 25-LED matrix, two programmable buttons, an accelerometer, a compass and a built-in microphone and speaker
- Built-in sensors: Includes an accelerometer, compass, and light sensor
- Features Bluetooth and radio communication
- Programmable LEDs
- USB connector
- Battery holder
Competencies Developed Through This Product:
- Introduction to coding
- Data collection
- Wireless communication
- Interactive projects
- Creativity and innovation
Benefits:
- Accessible to beginners through block-based coding, while also offering more advanced programming options like Python and JavaScript for experienced learners
- With built-in Bluetooth and radio, learners can explore wireless communication and create more complex, interactive projects