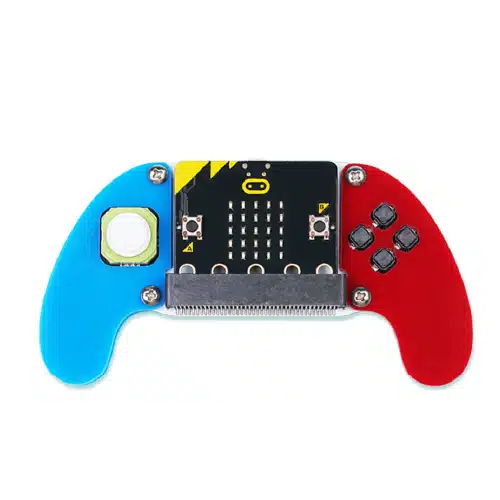
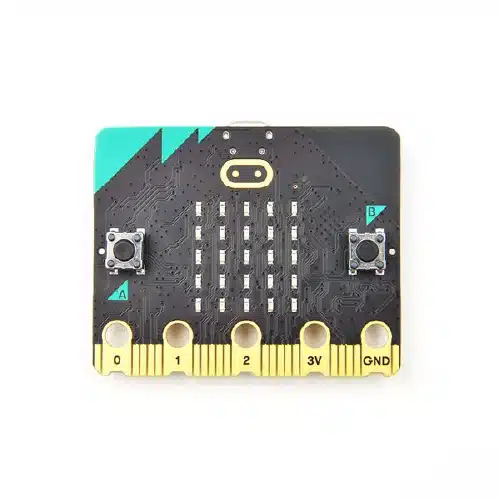
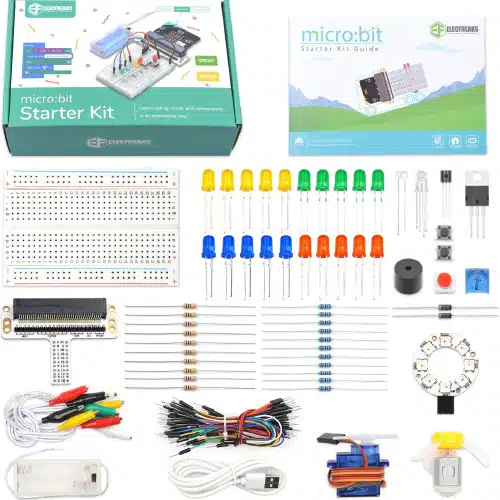
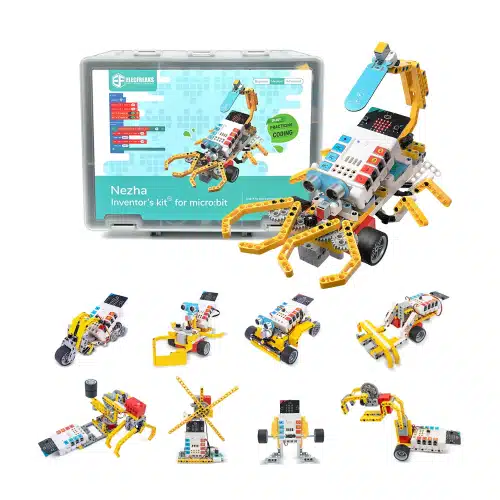
The ELECFREAKS micro:bit Ring:bit V2 is an expansion board designed specifically for the micro:bit, making it easier to connect and control various electronic components. This compact and versatile board opens up a world of possibilities for micro:bit projects, enabling users to create interactive and programmable designs with ease.
Contains:
- Ring mirco:bit v2 expansion board
- Servo ports
- LED connections
- Battery holder
- Connection cables
Competencies Developed Through This Product:
- Coding and programming
- Electronics and circuit design
- Creative design
- Problem-solving
Benefits:
- easy to use, making it accessible for beginners while still offering advanced functionality for more experienced users
- Compatible with a wide range of electronic components, allowing for endless creative possibilities
- ideal for portable projects and on-the-go learning
- Expands the capabilities of your micro:bit, enabling more complex and interactive designs
- Inspires learners to think creatively and develop their own unique projects