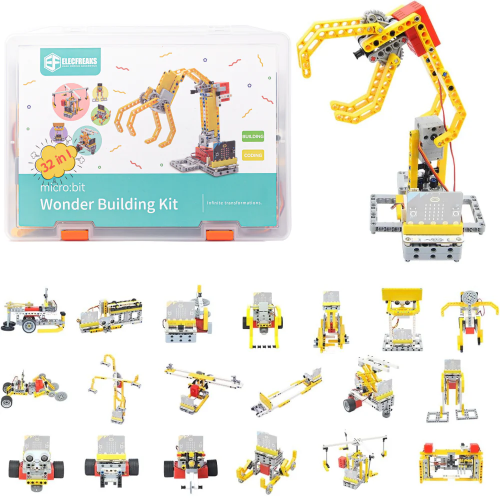
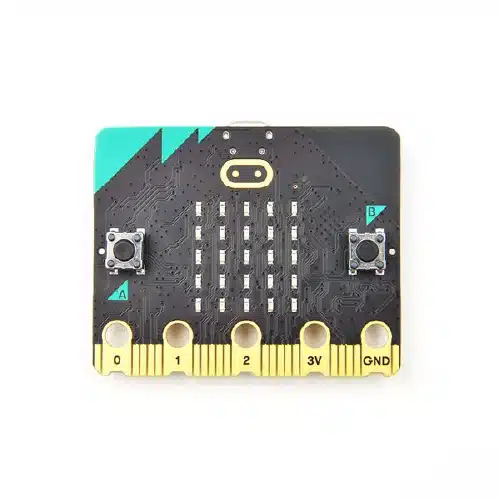
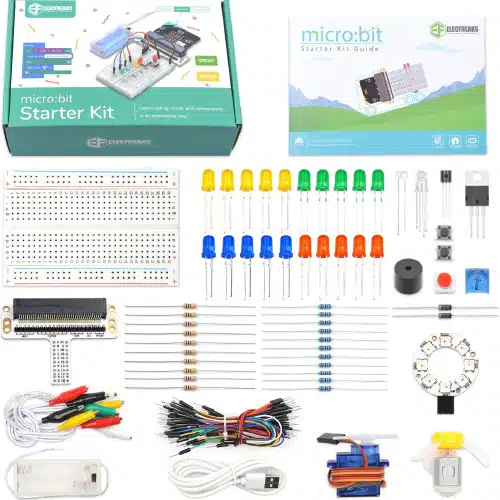
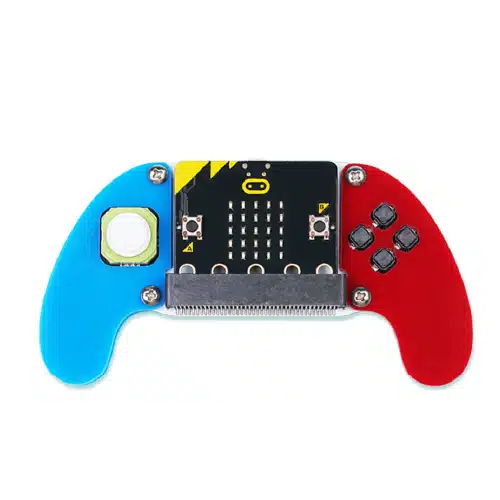
The ELECFREAKS Nezha Inventor’s Kit V2 for micro:bit is an all-in-one educational solution designed to introduce students to the world of STEAM (Science, Technology, Engineering, Arts, and Mathematics) through interactive and engaging robotics projects.
Contains:
- Over 400 pieces of building bricks which can build over 48 cases
- Nezha expansion board
- Sensors and motors: Including ultrasonic sensors, line-following sensors and servos
- Additional Components: Includes resistors, LEDs, buzzers and more to create a wide variety of electronic circuits
- Power module
- Wiring and cables
Competencies Developed Through This Kit:
- Electronics and circuitry
- Robotics automation
- Innovation and creativity
- Coding and programming
- Environmental interaction
- Engineering design
Benefits:
- Offers a wide variety of components and projects, making it an excellent resource for advanced learners
- The Nezha board is compatible with additional micro:bit accessories, allowing for further exploration and creativity
- Provides practical experience in electronics, coding, and robotics, reinforcing key STEM concepts
- With 48 different projects to explore, learners can enjoy endless learning opportunities
Ideal for classrooms and coding clubs, where multiple students can work on different projects simultaneously.