Daily average price
Amounts in USD


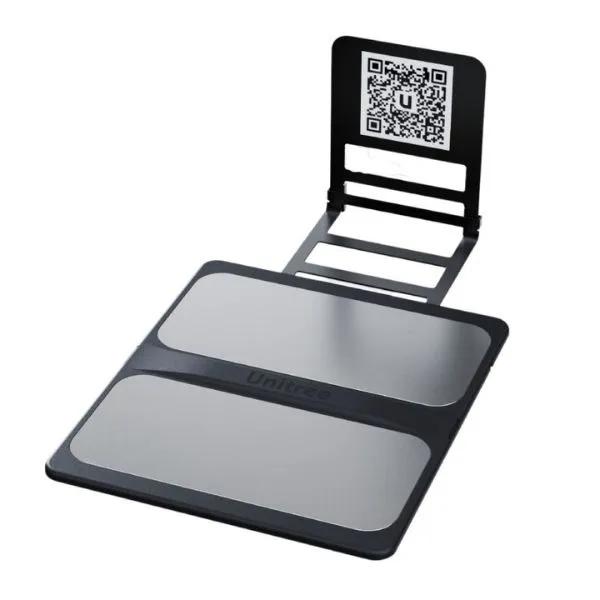
The GO2 Self-Charging Board from Unitree Robotics is a high-efficiency wireless charging solution designed specifically for the Unitree GO2 EDU Plus. Engineered for optimal performance and seamless integration, this board eliminates the need to remove the battery for recharging, ensuring uninterrupted operation for your quadruped robot.
Keep your Unitree GO2 quadruped running smoothly with the GO2 Self-Charging Board—your wireless power solution for uninterrupted robotics performance.
Price history
One data point per day, averaged by observation date.
Amounts in USD
Averages are computed per UTC day from every recorded offer price.

Unitree
$1,044

Unitree
999 €

Unitree
$990

Unitree
$1,080
Unitree
1,080 €

Unitree
$990

Unitree
999 €

Unitree
1,260 €

Unitree
$750

Unitree
$1,200

Unitree
$1,240
Unitree
$750
🍪 Cookie preferences
We use cookies to measure performance. Privacy Policy