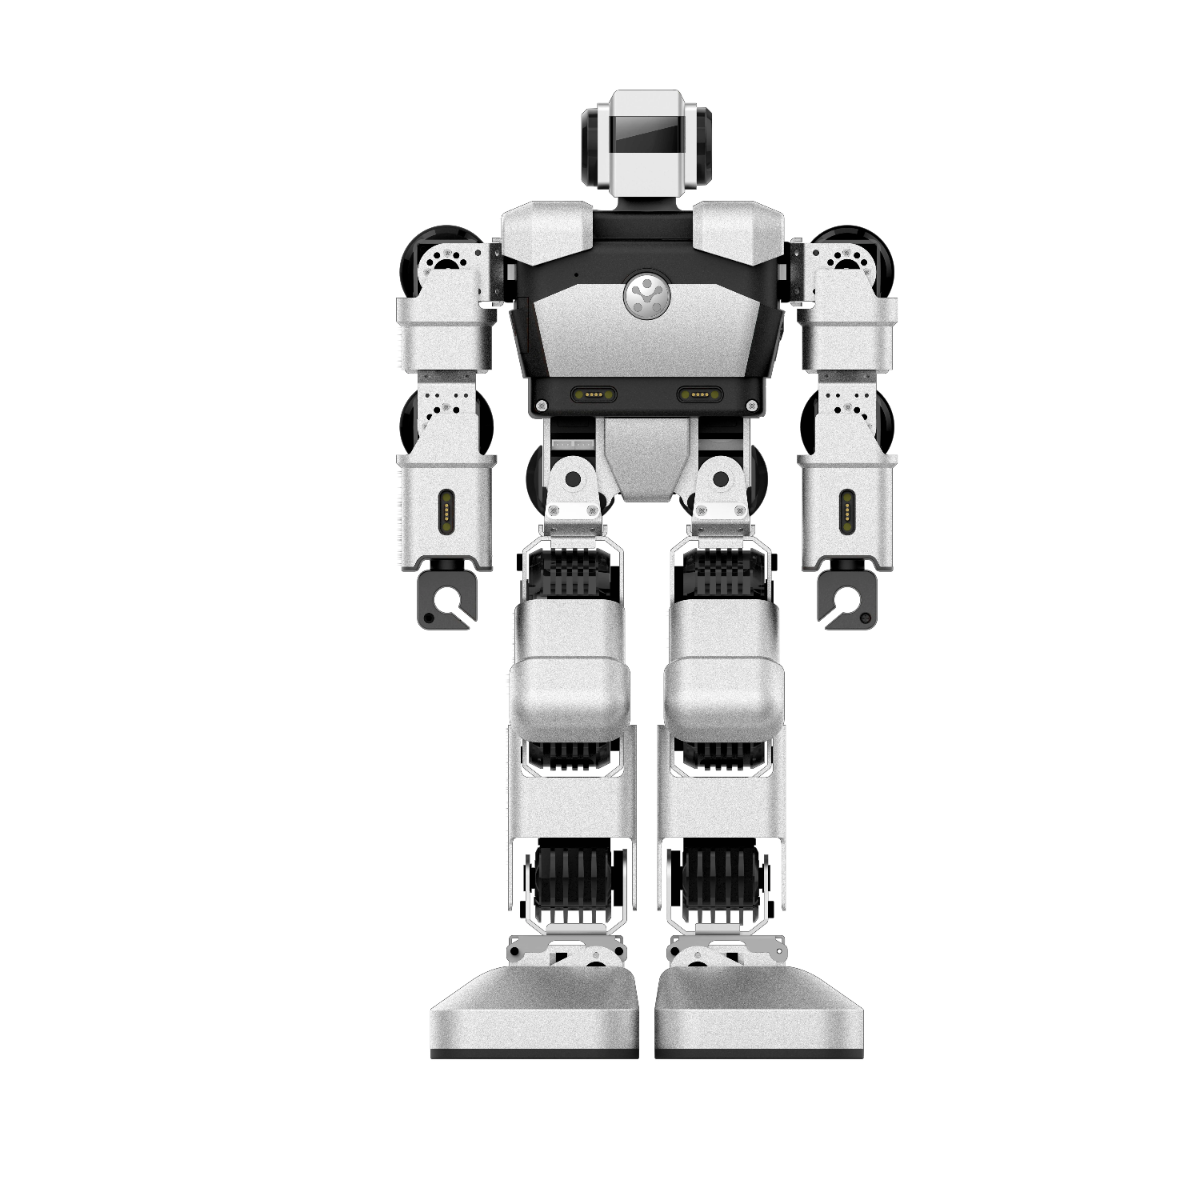
Alpha Mini is an advanced humanoid robot designed for interactive learning in coding, robotics, and artificial intelligence through real-world applications.
Contains:
- Alpha Mini robot
- Companion app for programming and control
- Charging dock
Competencies Developed Through this Product:
- Humanoid robotics
- Voice and motion control programming
- Facial and object recognition
- AI integration in robotics
- Interactive coding
- Problem-solving and innovation
Benefits:
- Engages learners with advanced robotics through interactive features and AI capabilities
- Enhances coding skills with real-time feedback and interactive programming
- Promotes creative problem-solving and innovation in a hands-on environment
- User-friendly companion app simplifies programming and control